
Why are data centres facing local protests, and how much water and power do they use?
Public support for data centres hinges on climate goals, geopolitics and local impact, and their grid and emissions effects depend on flexibility and the power mix.
Covers: The main drivers of local opposition to data centres (water use, electricity demand, noise, land and grid strain) and the best available estimates of their water and power consumption, including how figures vary by facility type and region. Does not cover individual company disputes or give investment advice.
Also answers: How much water do data centres use? · Why are people protesting data centres? · Data centre water and electricity consumption · Are data centres bad for local water and power?
The short answer
Interpretation AI-prepared starting mapData centres are fast-growing electricity consumers that also use water, and local opposition is increasingly common. Survey evidence from Germany finds public support depends heavily on decarbonisation, geopolitics and local environmental and economic impact, with people strongly preferring German or European operators over US or Chinese ones — an effect… 123
In brief
Local opposition is driven less by a single factor than by how a project is seen to affect climate goals, local economy and environment, and who owns it.1
Evidence-backedIn Germany, people strongly preferred German or European operators over US or Chinese ones, an effect larger than that of electricity price increases.1
Evidence-backedData centres are among the fastest-growing electricity consumers, and their flexibility can lower system costs by shifting load off-peak.3
Evidence-backedWhether flexibility cuts or raises emissions depends on how much renewable power is on the grid.3
Evidence-backedWhere emissions are counted — by location or by consumption — changes the picture: Ireland's cloud footprint is 85% export, Germany's 75% domestic.4
Evidence-backed
At a glance
The picture in numbers
Live · updated just now
99.9%
100 in every 100
75%
75 in every 100
85%
85 in every 100
The evidence behind it
5 sources- Other studies and data4
- Background1
Published in 2026
| Source | Kind | Year |
|---|---|---|
| How sovereign control, decarbonization and energy costs shape public support for data centers. | Other studies and data | 2026 |
| Estimating cross-border cloud computing emissions: A consumption-based approach applied to major European data center hubs. | Other studies and data | 2026 |
| Flexible data centers reduce power system costs but can increase emissions. | Other studies and data | 2026 |
| Pursuing a hierarchical taxonomy in a water-cooled data center room. | Other studies and data | 2026 |
| Data center (Wikipedia) | Background | Unknown |
The community around it
No one has added to this page yet. Firsthand experience, a newer study or a different reading of the numbers would show up here, credited to you.
The full explanation
Interpretation AI-prepared starting mapData centres are fast-growing electricity consumers that also use water, and local opposition is increasingly common. Survey evidence from Germany finds public support depends heavily on decarbonisation, geopolitics and local environmental and economic impact, with people strongly preferring German or European operators over US or Chinese ones — an effect larger than that of electricity price increases. On consumption, the evidence here is mostly about electricity and carbon rather than water: one Swedish water-cooled facility routed over 99.9% of its energy use to data-processing processes, and modelling of three US regions finds flexible data centres cut system costs by shifting load off-peak, with emissions effects depending on how much renewable power is on the grid.123
- Evidence 16
- Interpretation 4
What it means for you
Which fits you?
Pick the situation closest to yours. Each answer says what it rests on.
If you live near a proposed data centre and are weighing whether to support it
the evidence suggests asking about the operator's nationality and ownership, the facility's energy source, and its expected effect on local prices and jobs — these were the factors that most moved public support in a German survey experiment.1
Evidence-backedIf you are assessing a data centre's climate impact in your region
check whether emissions are counted where the facility sits or where the cloud service is consumed; in Ireland 85% of the cloud footprint served foreign consumers, while Germany's was 75% domestic.4
Evidence-backedIf you are concerned about grid strain from a new facility
ask whether it can shift workloads off-peak; modelling across three US regions found flexible data centres lowered system costs in every scenario.3
Evidence-backedIf you want a data centre to lower rather than raise emissions
the modelled outcome depends on renewable penetration: higher shares increase the emission-reduction potential of flexibility, while lower shares may raise emissions by favouring baseload generation.3
Evidence-backedIf you are comparing cooling designs for water and energy use
the available evidence covers a single Swedish in-rack water-cooled room, where over 99.9% of energy use went to data processing; it does not provide a like-for-like comparison with air-cooled facilities.2
Evidence-backedThe full story · 3 chapters
How it fits together
Chapter 1: Why data centres draw local opposition
AI summary:Opposition tracks views on decarbonisation, geopolitics and local impact, with strong preference for German or European operators over US or Chinese ones.
Evidence-backed: Data centres are described as requiring enormous amounts of electricity and water, threatening emission-reduction targets and often raising local electricity prices — and as a result local communities increasingly mobilise against construction.1
Evidence-backed: In a German vignette and conjoint survey experiment, priming people with digital-sovereignty concerns only marginally increased support for building more data centres. Support varied substantially instead with views on decarbonisation, geopolitics and local environmental and economic impact. Geopolitical concerns were especially salient: people strongly favoured data centres run by German or European firms over US or Chinese operators, and these nationality effects were large even compared with the effects of electricity price increases and different energy sources. The authors conclude that opposition depends on pre-existing political cleavages.1
Interpretation: Read together, these results suggest local opposition is not a single-issue reaction to size or water alone: it tracks how a project is seen to affect climate goals, who owns it, and what it does to the local economy and environment. That framing helps explain why the same facility type can be welcomed in one place and resisted in another.1
Chapter 2: Power use and the grid
AI summary:Flexible data centres cut system costs by shifting load off-peak, but whether emissions fall depends on renewable share; one Swedish facility routed nearly all energy to data processing.
Evidence-backed: Data centres are among the fastest-growing electricity consumers, raising concerns about grid operations and decarbonisation. Modelling of three US regions — Mid-Atlantic, Texas and the Western Interconnect — found that flexible data centres, able to shift workloads over time, reduced system costs in every scenario by moving load from peak to off-peak hours, flattening net demand and supporting both renewable and baseload resources. The emissions effect depends on which effect dominates: higher renewable penetration increases the emission-reduction potential of flexibility, while lower shares favour baseload generation and may raise emissions.3
Evidence-backed: In a Swedish data-centre room with in-rack water cooling operated by Ericsson, a hierarchical energy-flow analysis identified six energy-use processes, four tied to data processing and two to support functions. Over 99.9% of total energy use was connected to data-processing processes — a much higher share than in other production processes in other sectors — and the resulting indicators are intended to allow benchmarking between similar facilities.2
Interpretation: The practical implication is that a data centre's grid impact is not fixed by its size alone: whether it can shift load, and what generation sits behind it, shape both cost and emissions outcomes. That is a point about system design, not a guarantee for any particular project.3
This part rests on
2. Pursuing a hierarchical taxonomy in a water-cooled data center room.
The methodology combines hierarchical classification of energy flows with quantitative analysis based on time-resolved operational data, allowing for detailed analysis of dynamic system behaviour and allocation of energy use across processes, applied to a DC room with a detached in-rack water cooling system in Sweden operated by Ericsson. The results of this paper present a novel hierarchical taxonomy for a water-cooled DC room with six defined EEU processes, of which four are related to data processing processes and two to support processes. Notably, over 99.9% of total EEU is connected to data processing processes which is a significantly higher figure compared to other production processes in other sectors. Moreover, the established EnPIs can facilitate benchmarking between DCs with similar infrastructures and for monitoring the energy use of various EEU processes. The proposed methodology is transferable to other DC environments with comparable system boundaries and data availability, and its reproducibility is supported by the structured and data-driven methodology, which enables replication of the analytical approach given comparable data availability.Read original source
3. Flexible data centers reduce power system costs but can increase emissions.
Data centers are among the fastest growing electricity consumers, raising concerns about their impact on grid operations and decarbonization goals. Their temporal flexibility-the ability to shift workloads over time-offers a source of demand-side flexibility. We model power systems in three US regions, Mid-Atlantic, Texas, and Western Interconnect (WECC), under varying flexibility levels. We evaluate flexibility's effects on grid operations, investment, system costs, and emissions. Across all scenarios, flexible data centers reduced costs by shifting load from peak to off-peak hours, flattening net demand and supporting renewable and baseload resources. This load shifting facilitates renewable integration while improving the utilization of existing baseload capacity. As a result, the emissions' impact depends on which effect dominates. Higher renewable penetration increases the emission reduction potential of data center flexibility, while lower shares favor baseload generation and may raise emissions. Our findings highlight the importance of aligning data center flexibility with renewable deployment and regional conditions.Read original source
2 independent sources
- Workloads shift over timeFlexible data centres move load from peak to off-peak hours
- Net demand flattensFlattening supports renewable and baseload resources
- Costs fallSystem costs reduced in every modelled scenario
- Emissions depend on gridHigher renewables favour cuts; lower shares may raise emissions
Drawn from this chapter's text
Chapter 3: Water use and where emissions are counted
AI summary:Water is cited as a pressure but not quantified here; carbon accounting differs, with Germany's footprint mostly domestic and Ireland's mostly export.
Evidence-backed: Water appears in the debate mainly as a stated pressure: data centres are said to require enormous amounts of electricity and water, and this feeds local mobilisation. The sources here do not quantify water consumption per facility or per region.1
Evidence-backed: On carbon, a consumption-based accounting study of the EU's three largest data-centre hubs from 2017 to 2022 found distinct profiles: Germany's cloud footprint was predominantly domestic (75%), Ireland's was export-dominated (85% serving foreign consumers), and the Netherlands showed balanced flows. Standard location-based accounting attributes emissions to where data centres sit, which can obscure where demand actually lies; consumption-based metrics can complement territorial accounting for national climate planning.4
Interpretation: This matters for local politics because a facility's climate footprint, as counted nationally, may not match the benefit it delivers locally or the burden it places on a host community's grid and water. The accounting choice can therefore change who looks responsible for the emissions.4
Add a source or a different interpretation
What would strengthen or challenge this answer?
Your contribution joins the discussion. Changes to the shared answer are reviewed separately.
Your turn
Where do you stand?
The conversation starts here
A few questions from this page to take the topic further. Bring a source, another angle or something you've tried.
3 open questions
- ResearcherLooks for evidenceFrom this page
The page says no source gives a litres-per-facility figure or a comparison across cooling designs. What kind of measurement or study would fill that gap for water use across water-cooled, air-cooled and in-rack designs?
- ChallengerTests an assumptionFrom this page
The page notes flexibility's emissions effect depends on how much renewable power is on the grid. In which grid or regional conditions might shifting data-centre load off-peak fail to lower system costs or emissions?
- ExplorerInvites experienceFrom this page
The page says local opposition hinges on how a project is seen to affect climate goals, the local economy and environment, and who owns it. Have you seen a data-centre project where one of these weighed most heavily?
Test what you remember
Fill in the blank: ?% of one Swedish water-cooled facility's energy use went to data processing
Drag the slider to fill in the blank
Did this answer your question?
Be the first to voteMore quick questions: how you feel, and questions from connected pages
How do you feel about this?
No votes yetQuick questions from connected pages
Keep exploring
Where this leads
Why are data centres facing local protests, and how much water and power do they use?You are here
A different angle
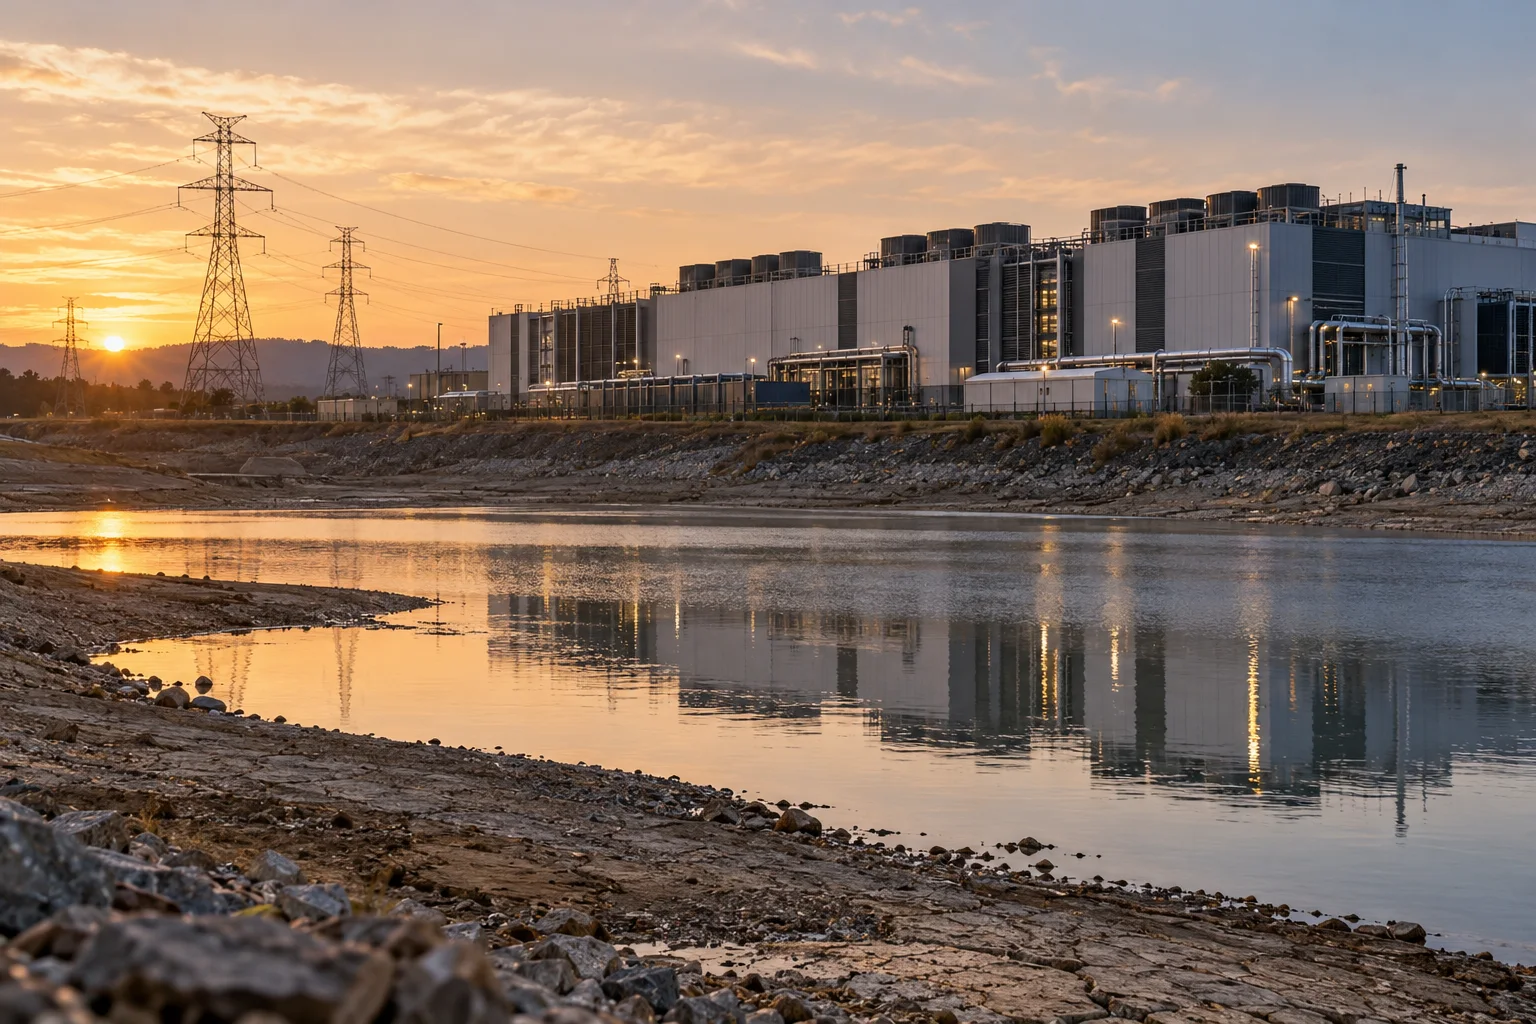
One finding can inform several topics. Connections and subtopic reports are shown for exploring; they aren't extra evidence for this page.
Before you go
What to remember
Try to recall each hidden figure before you reveal it. Remembering, not rereading, is what makes it stick.
Where emissions are counted — by location or by consumption — changes the picture: Ireland's cloud footprint is export, Germany's 75% domestic.
Local opposition is driven less by a single factor than by how a project is seen to affect climate goals, local economy and environment, and who owns it.
In Germany, people strongly preferred German or European operators over US or Chinese ones, an effect larger than that of electricity price increases.
Your reading
0 of 3 chaptersThis answer keeps changing
When new evidence or a better source comes in, this page is updated (it's on version 2, last changed 3 hours ago). Follow it to be told when that happens.
 Up nextHow do data centres affect local water and power supplies?How do data centres affect local water and power supplies, and what does the evidence say about the scale of those impacts?
Ask this Sylo
Still wondering about something?
Answers come only from this page's reviewed material, with citations, and say plainly when the page doesn't cover it yet.
Follow the story
This page changes as sources and experiences are reviewed. Follow it, share it or add what you know.
Behind this page
Who's adding to it, where it comes from, how it changed and what would make it better. Always open to everyone.
Discussion
Sources
Numbers match the citations in the article. A working link isn't proof that a page supports a claim; check the quoted passage and date.
- 1How sovereign control, decarbonization and energy costs shape public support for data centers.Nature communications (Heering & Voeten)Published Aug 10, 2026Checked Oct 17, 2026
“However, data centers require enormous amounts of electricity and water, threaten emission-reduction targets, and often raise local electricity prices. As a result, local communities increasingly mobilize against data center construction. We use a vignette and conjoint survey experiment in Germany to evaluate how publics think about the environmental, economic, and (geo)political tradeoffs that data centers entail. We find that directly priming people with digital sovereignty concerns only marginally increases support for building more data centers. Yet, support varies substantially based on characteristics that people do have strong views about: decarbonization, geopolitics, and local environmental and economic impact. Geopolitical concerns are particularly salient: people strongly favor data centers operated by German or European firms over US or Chinese operators. These nationality effects are large even when compared to the effects of electricity price increases and variation in energy sources. Our findings suggest that public opposition to data centers depends on pre-existing political cleavages and that sovereignty concerns loom large.”
- 2Pursuing a hierarchical taxonomy in a water-cooled data center room.Scientific reports (Milić et al.)Published Aug 24, 2026Checked Oct 17, 2026
“The methodology combines hierarchical classification of energy flows with quantitative analysis based on time-resolved operational data, allowing for detailed analysis of dynamic system behaviour and allocation of energy use across processes, applied to a DC room with a detached in-rack water cooling system in Sweden operated by Ericsson. The results of this paper present a novel hierarchical taxonomy for a water-cooled DC room with six defined EEU processes, of which four are related to data processing processes and two to support processes. Notably, over 99.9% of total EEU is connected to data processing processes which is a significantly higher figure compared to other production processes in other sectors. Moreover, the established EnPIs can facilitate benchmarking between DCs with similar infrastructures and for monitoring the energy use of various EEU processes. The proposed methodology is transferable to other DC environments with comparable system boundaries and data availability, and its reproducibility is supported by the structured and data-driven methodology, which enables replication of the analytical approach given comparable data availability.”
- 3Flexible data centers reduce power system costs but can increase emissions.iScience (Senga et al.)Published Jun 26, 2026Checked Oct 17, 2026
“Data centers are among the fastest growing electricity consumers, raising concerns about their impact on grid operations and decarbonization goals. Their temporal flexibility-the ability to shift workloads over time-offers a source of demand-side flexibility. We model power systems in three US regions, Mid-Atlantic, Texas, and Western Interconnect (WECC), under varying flexibility levels. We evaluate flexibility's effects on grid operations, investment, system costs, and emissions. Across all scenarios, flexible data centers reduced costs by shifting load from peak to off-peak hours, flattening net demand and supporting renewable and baseload resources. This load shifting facilitates renewable integration while improving the utilization of existing baseload capacity. As a result, the emissions' impact depends on which effect dominates. Higher renewable penetration increases the emission reduction potential of data center flexibility, while lower shares favor baseload generation and may raise emissions. Our findings highlight the importance of aligning data center flexibility with renewable deployment and regional conditions.”
- 4Estimating cross-border cloud computing emissions: A consumption-based approach applied to major European data center hubs.iScience (Soares et al.)Published May 22, 2026Checked Oct 17, 2026
“Cloud computing's expansion creates a significant carbon footprint from data center energy consumption. Standard location-based accounting attributes cloud emissions to countries where data centers are located, potentially obscuring where actual demand lies when services are consumed across borders. This study develops a consumption-based accounting approach to estimate cross-border cloud emission flows among the EU's three largest data center hubs: Germany, Ireland, and the Netherlands, from 2017 to 2022. Using electricity consumption and emissions for data centers and telecommunications networks, we classify cloud activity as domestic (hosted and consumed within one country), export (domestic hosting, foreign consumption), or import (foreign hosting, domestic consumption). The analysis reveals distinct profiles: Germany's cloud footprint is predominantly domestic (75%), Ireland's is export-dominated (85% serves foreign consumers), and the Netherlands exhibits balanced flows. Consumption-based metrics can complement territorial accounting by revealing cross-border emission flows relevant to national climate planning and infrastructure policy decisions.”
- 5Data center (Wikipedia)WikipediaPublished Oct 16, 2026Checked Oct 17, 2026
“A data center is a physical room, building, or facility for storing, managing, and disseminating data and information, including computer systems and associated components, housing IT infrastructure, and training artificial intelligence. The United States' act of Congress, the Energy Independence and Security Act of 2007, defines a data center as "any facility that primarily contains electronic equipment used to process, store, and transmit digital information." This includes "a free-standing structure" or "a facility within a larger structure, that uses environmental control equipment to maintain the proper conditions for the operation of electronic equipment." According to IBM, data centers date back to the 1940s, with the U.S. military's Electrical Numerical Integrator and Computer (ENIAC) as an early example. Data centers have different models depending on their workloads.”
How it changed
Published 1 time since Oct 17, 2026.
- Version 2Oct 17, 2026Live now
AI-prepared Starting Map from live research.
- First published version.
Help improve it
The brief is open about what's uncertain. These are the specific gaps that new material would fill.
“Why data centres draw local opposition” rests on one independent source
A second, independent source that confirms or challenges it would make this part more reliable.
Open questions
How much water does a typical data centre use per year, and how does that differ between water-cooled, air-cooled and in-rack cooling designs?
No answers yet
What are current sector-wide electricity totals for major data-centre regions, and how fast are they growing?
No answers yet
How large are noise, land-use and local grid-connection impacts compared with water and price effects in driving opposition?
No answers yet
Do the German survey findings on operator nationality and decarbonisation hold in other countries and for actual planning decisions?
No answers yet
Explore how this topic connects
Narrower questions connect to broader Sylos. Explore their findings, sources and the people contributing to each.